Neurons example, pt. 1
Contents
Neurons example, pt. 1
Generate some data
import altair as alt
import numpy as np
from bayes_window import models, fake_spikes_explore, BayesWindow, BayesRegression, LMERegression
from bayes_window.generative_models import generate_fake_spikes

alt.data_transformers.disable_max_rows()
try:
    alt.renderers.enable('altair_saver', fmts=['png'])
except Exception:
    pass
df, df_monster, index_cols, firing_rates = generate_fake_spikes(n_trials=20,
                                                                n_neurons=6,
                                                                n_mice=3,
                                                                dur=5,
                                                                mouse_response_slope=40,
                                                                overall_stim_response_strength=5)
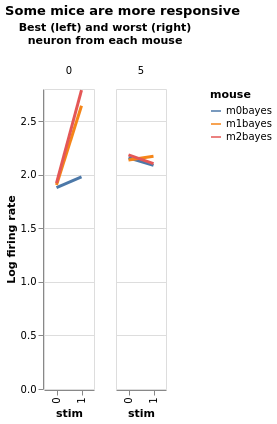
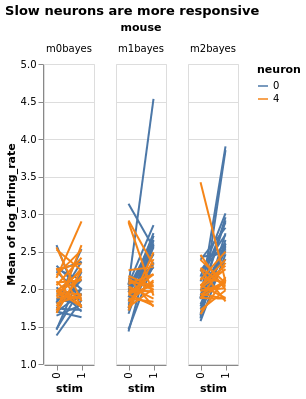
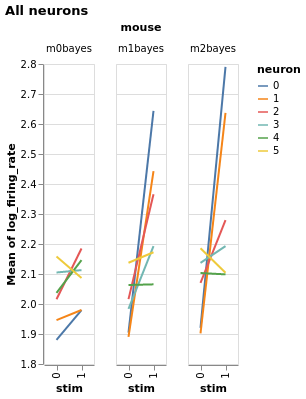
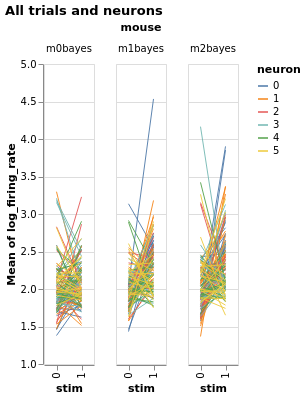
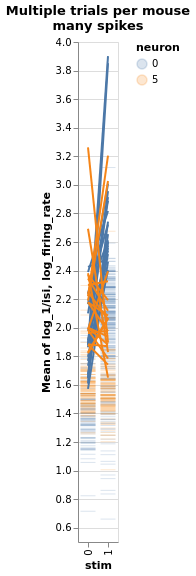
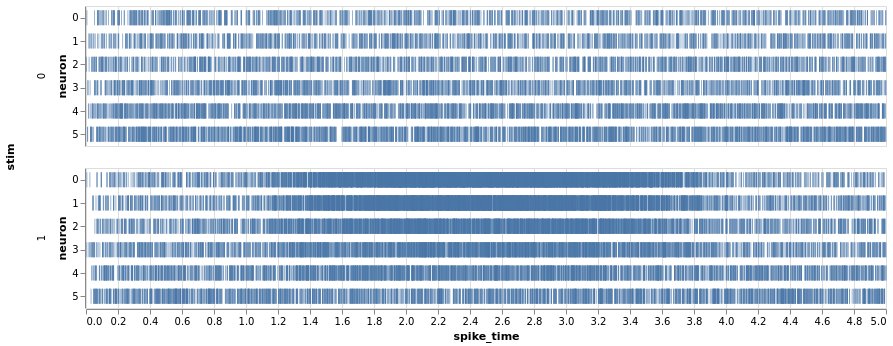
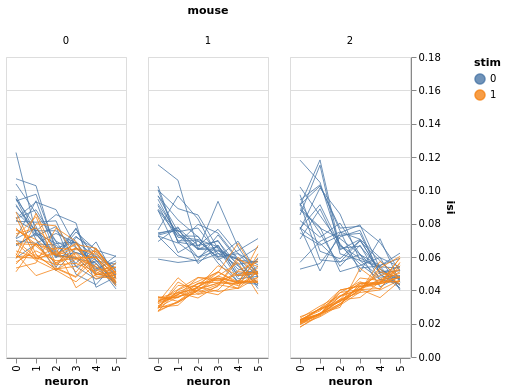
Exploratory plot without any fitting
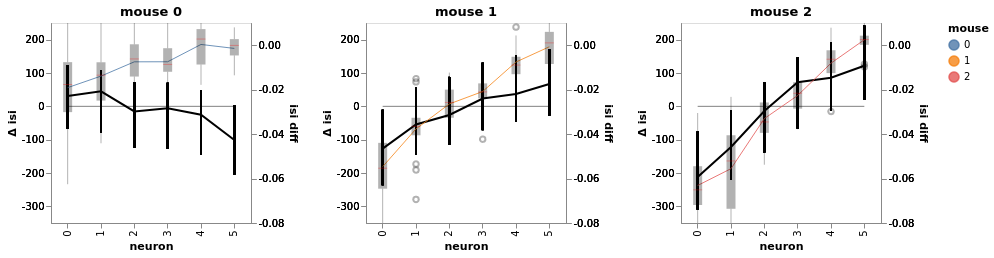
Three mice, five neurons each. Mouse #0/neuron #4 has the least effect, mouse #2/neuron #0 the most
charts = fake_spikes_explore(df=df, df_monster=df_monster, index_cols=index_cols)
[chart.display() for chart in charts];
#fig_mice, fig_select, fig_neurons, fig_trials, fig_isi + fig_overlay, bar, box, fig_raster, bar_combined
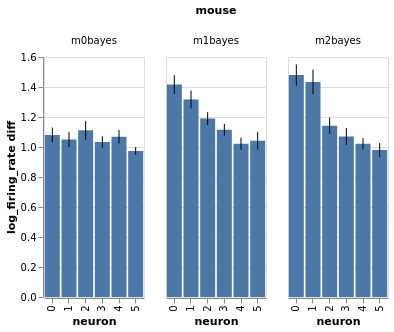
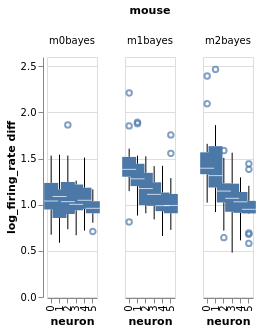
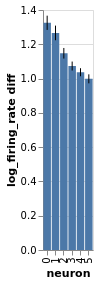
Estimate with neuron as condition
ISI
df['log_isi'] = np.log10(df['isi'])
bw = BayesWindow(df_monster, y='isi', treatment='stim', condition=['neuron', 'mouse'], group='mouse')
bw.plot(x='neuron', color='stim', detail='i_trial', add_box=False).facet(column='mouse', )
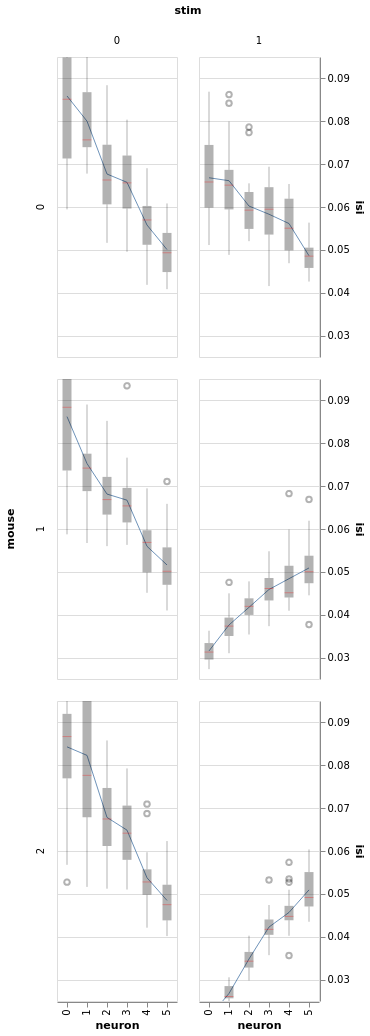
bw = BayesWindow(df=df, y='isi', treatment='stim', condition=['neuron', 'mouse'], group='mouse')
bw.plot(x='neuron', add_box=True).facet(row='mouse', column='stim')
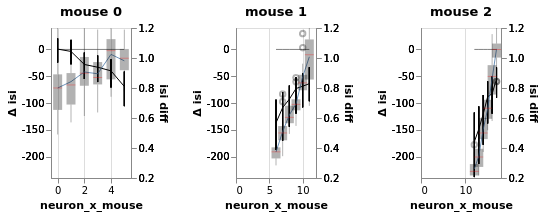
Vanilla regression
bw = BayesRegression(df=df, y='isi', treatment='stim', condition=['neuron_x_mouse'], group='mouse', detail='i_trial')
bw.fit(model=(models.model_hierarchical),
       do_make_change='divide',
       dist_y='normal',
       )

bw.chart
2021-11-25 00:49:34.852136: E external/org_tensorflow/tensorflow/stream_executor/cuda/cuda_driver.cc:271] failed call to cuInit: CUDA_ERROR_COMPAT_NOT_SUPPORTED_ON_DEVICE: forward compatibility was attempted on non supported HW
2021-11-25 00:49:34.852268: E external/org_tensorflow/tensorflow/stream_executor/cuda/cuda_diagnostics.cc:313] kernel version 450.142.0 does not match DSO version 450.156.0 -- cannot find working devices in this configuration
n(Divergences) = 1
GLM
(\(y\sim Gamma(\theta)\))
bw = BayesRegression(df=df, y='isi', treatment='stim', condition=['neuron', 'mouse'], group='mouse', detail='i_trial')
bw.fit(model=models.model_hierarchical,
       do_make_change='subtract',
       dist_y='gamma',
       add_group_intercept=True,
       add_group_slope=True,
       fold_change_index_cols=('stim', 'mouse', 'neuron', 'neuron_x_mouse', 'i_trial'))

bw.plot(x='neuron', color='mouse', independent_axes=True, finalize=True)

bw.facet(column='mouse', width=200, height=200).display()
n(Divergences) = 1
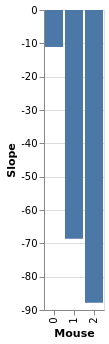
import altair as alt

slopes = bw.trace.posterior['slope_per_group'].mean(['chain', 'draw']).to_dataframe().reset_index()
chart_slopes = alt.Chart(slopes).mark_bar().encode(
    x=alt.X('mouse_:O', title='Mouse'),
    y=alt.Y('slope_per_group', title='Slope')
)
chart_slopes
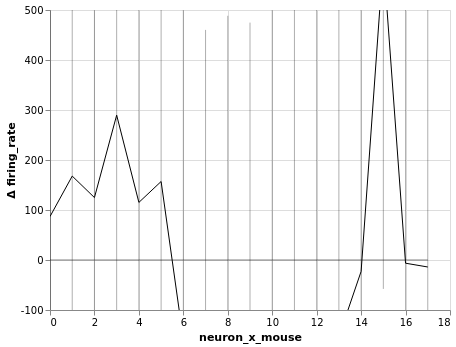
bw = LMERegression(df=df, y='firing_rate', treatment='stim', condition='neuron_x_mouse', group='mouse', )
#bw.fit_anova()
bw.fit()
Using formula firing_rate ~ (1|mouse) + stim| neuron_x_mouse__0 + stim|neuron_x_mouse__1 + stim|neuron_x_mouse__2 + stim|neuron_x_mouse__3 + stim|neuron_x_mouse__4 + stim|neuron_x_mouse__5 + stim|neuron_x_mouse__6 + stim|neuron_x_mouse__7 + stim|neuron_x_mouse__8 + stim|neuron_x_mouse__9 + stim|neuron_x_mouse__10 + stim|neuron_x_mouse__11 + stim|neuron_x_mouse__12 + stim|neuron_x_mouse__13 + stim|neuron_x_mouse__14 + stim|neuron_x_mouse__15 + stim|neuron_x_mouse__16 + stim|neuron_x_mouse__17
                               Coef. Std.Err.       z  P>|z|    [0.025  \
Intercept                    106.728  316.270   0.337  0.736  -513.150
1 | mouse                     48.910  164.553   0.297  0.766  -273.608
stim | neuron_x_mouse__0      86.929  339.810   0.256  0.798  -579.086
stim | neuron_x_mouse__1     167.872  339.810   0.494  0.621  -498.144
stim | neuron_x_mouse__2     124.871  339.810   0.367  0.713  -541.144
stim | neuron_x_mouse__3     289.665  339.810   0.852  0.394  -376.350
stim | neuron_x_mouse__4     115.181  339.810   0.339  0.735  -550.835
stim | neuron_x_mouse__5     157.028  339.810   0.462  0.644  -508.987
stim | neuron_x_mouse__6    -159.325  339.810  -0.469  0.639  -825.340
stim | neuron_x_mouse__7    -205.802  339.810  -0.606  0.545  -871.818
stim | neuron_x_mouse__8    -177.574  339.810  -0.523  0.601  -843.589
stim | neuron_x_mouse__9    -191.205  339.810  -0.563  0.574  -857.220
stim | neuron_x_mouse__10   -129.423  339.810  -0.381  0.703  -795.438
stim | neuron_x_mouse__11   -135.534  339.810  -0.399  0.690  -801.549
stim | neuron_x_mouse__12   -153.550  336.526  -0.456  0.648  -813.128
stim | neuron_x_mouse__13   -153.257  336.526  -0.455  0.649  -812.836
stim | neuron_x_mouse__14    -22.789  336.526  -0.068  0.946  -682.367
stim | neuron_x_mouse__15    601.748  336.526   1.788  0.074   -57.830
stim | neuron_x_mouse__16     -6.437  336.526  -0.019  0.985  -666.015
stim | neuron_x_mouse__17    -13.975  336.526  -0.042  0.967  -673.553
Group Var                  54331.941   69.811

                             0.975]
Intercept                   726.606
1 | mouse                   371.427
stim | neuron_x_mouse__0    752.944
stim | neuron_x_mouse__1    833.887
stim | neuron_x_mouse__2    790.887
stim | neuron_x_mouse__3    955.681
stim | neuron_x_mouse__4    781.196
stim | neuron_x_mouse__5    823.044
stim | neuron_x_mouse__6    506.691
stim | neuron_x_mouse__7    460.213
stim | neuron_x_mouse__8    488.441
stim | neuron_x_mouse__9    474.810
stim | neuron_x_mouse__10   536.592
stim | neuron_x_mouse__11   530.482
stim | neuron_x_mouse__12   506.029
stim | neuron_x_mouse__13   506.321
stim | neuron_x_mouse__14   636.790
stim | neuron_x_mouse__15  1261.327
stim | neuron_x_mouse__16   653.141
stim | neuron_x_mouse__17   645.604
Group Var
<bayes_window.lme.LMERegression at 0x7f12aef02220>
bw.plot(x='neuron_x_mouse:O')
Firing rate
bw = BayesRegression(df=df, y='firing_rate', treatment='stim', condition='neuron_x_mouse', group='mouse')
bw.fit(model=models.model_hierarchical, do_make_change='subtract',
       progress_bar=False,
       dist_y='student',
       add_group_slope=True, add_group_intercept=False,
       fold_change_index_cols=('stim', 'mouse', 'neuron', 'neuron_x_mouse'))

bw.plot(x='neuron', color='mouse', independent_axes=True, finalize=True)
bw.facet(column='mouse', width=200, height=200).display()
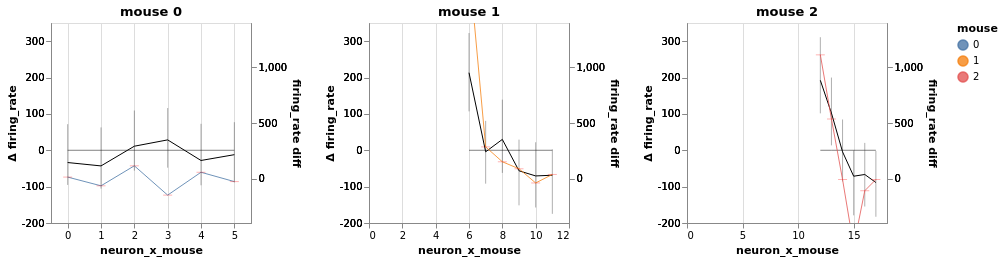
ANOVA may not be appropriate here: It considers every neuron. If we look hard enough, surely we’ll find a responsive neuron or two out of hundreds?
bw = LMERegression(df=df, y='firing_rate', treatment='stim', condition='neuron_x_mouse', group='mouse')

bw.fit(formula='firing_rate ~ stim+ mouse + stim*mouse + neuron_x_mouse + stim * neuron_x_mouse');
Using formula firing_rate ~ stim+ mouse + stim*mouse + neuron_x_mouse + stim * neuron_x_mouse
                        Coef. Std.Err.       z  P>|z|    [0.025    0.975]
Intercept              77.712  163.910   0.474  0.635  -243.547   398.970
stim                  548.607  231.804   2.367  0.018    94.278  1002.935
mouse                 -77.367  283.026  -0.273  0.785  -632.089   477.354
stim:mouse           1151.346  400.260   2.876  0.004   366.851  1935.841
neuron_x_mouse         23.377   44.542   0.525  0.600   -63.924   110.678
stim:neuron_x_mouse  -178.392   62.992  -2.832  0.005  -301.854   -54.930
Group Var               0.001
/home/m/env_jb1/lib/python3.8/site-packages/statsmodels/regression/mixed_linear_model.py:2237: ConvergenceWarning: The MLE may be on the boundary of the parameter space.
  warnings.warn(msg, ConvergenceWarning)
/home/m/env_jb1/lib/python3.8/site-packages/statsmodels/regression/mixed_linear_model.py:2261: ConvergenceWarning: The Hessian matrix at the estimated parameter values is not positive definite.
  warnings.warn(msg, ConvergenceWarning)
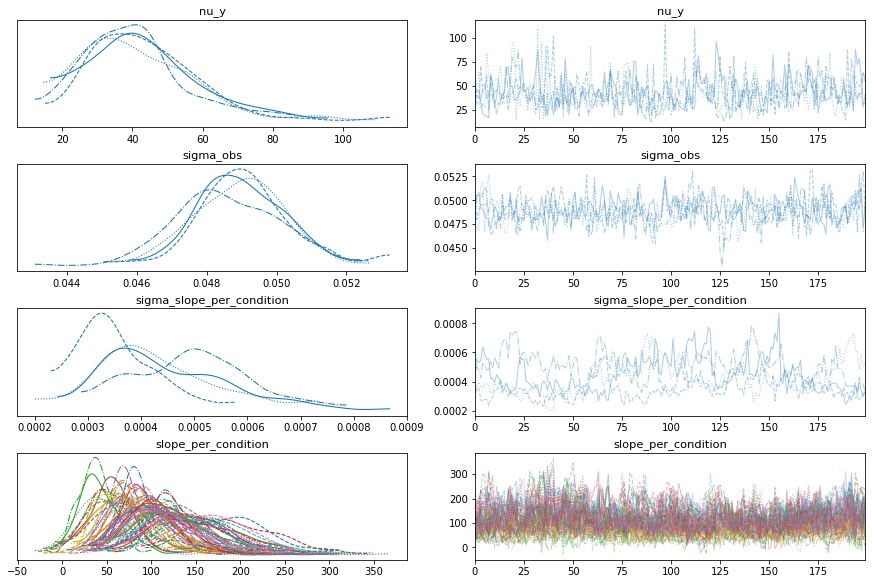
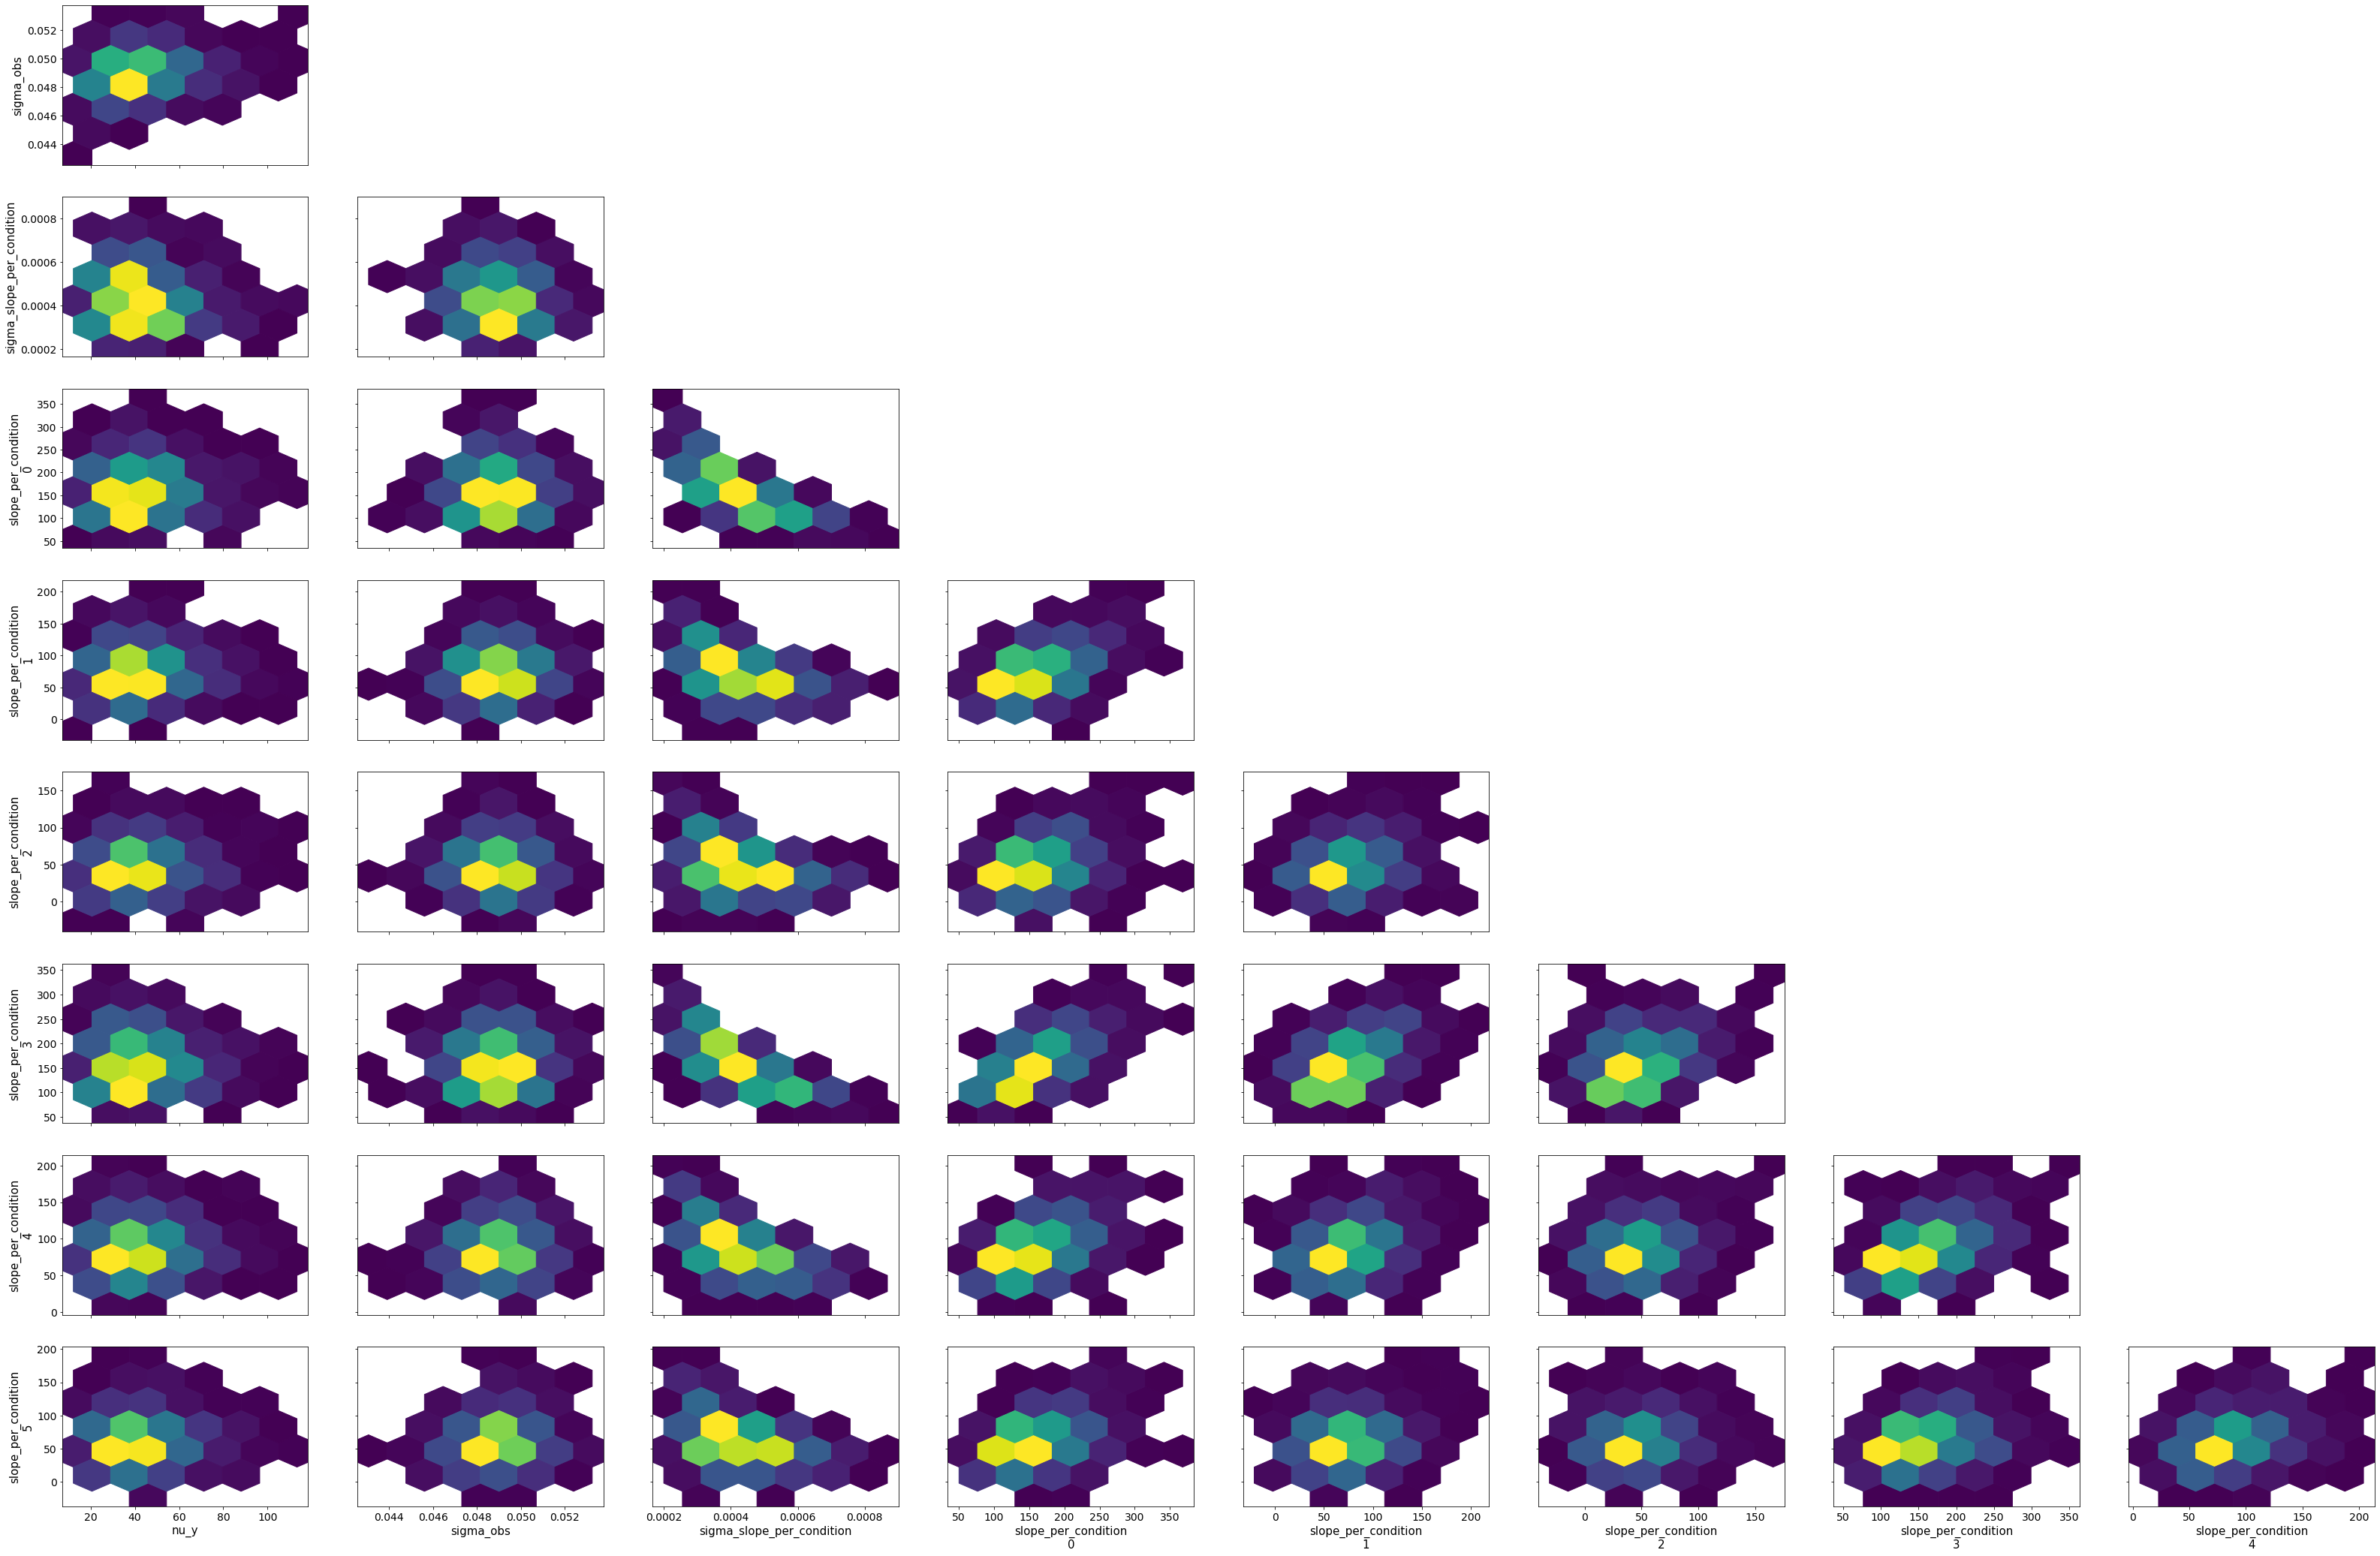
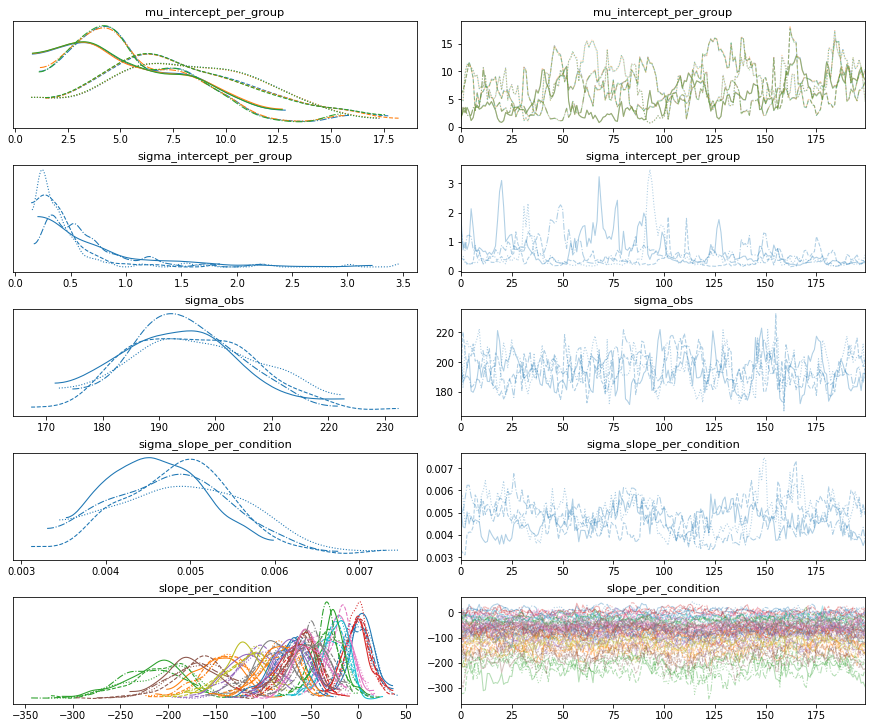
Model quality
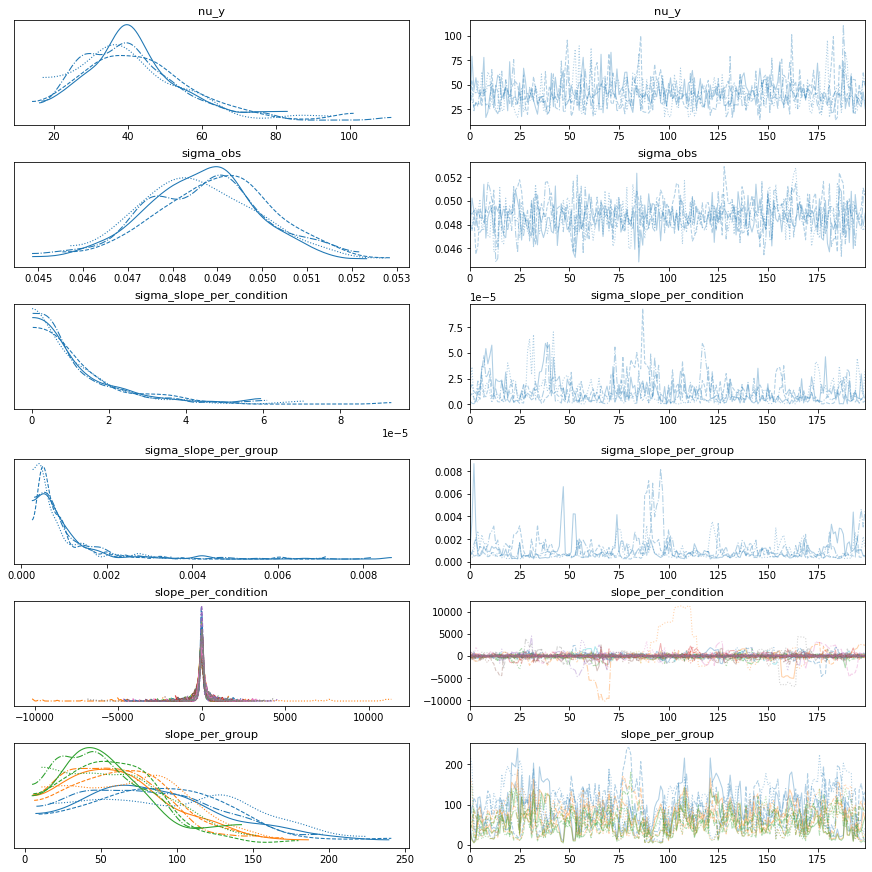
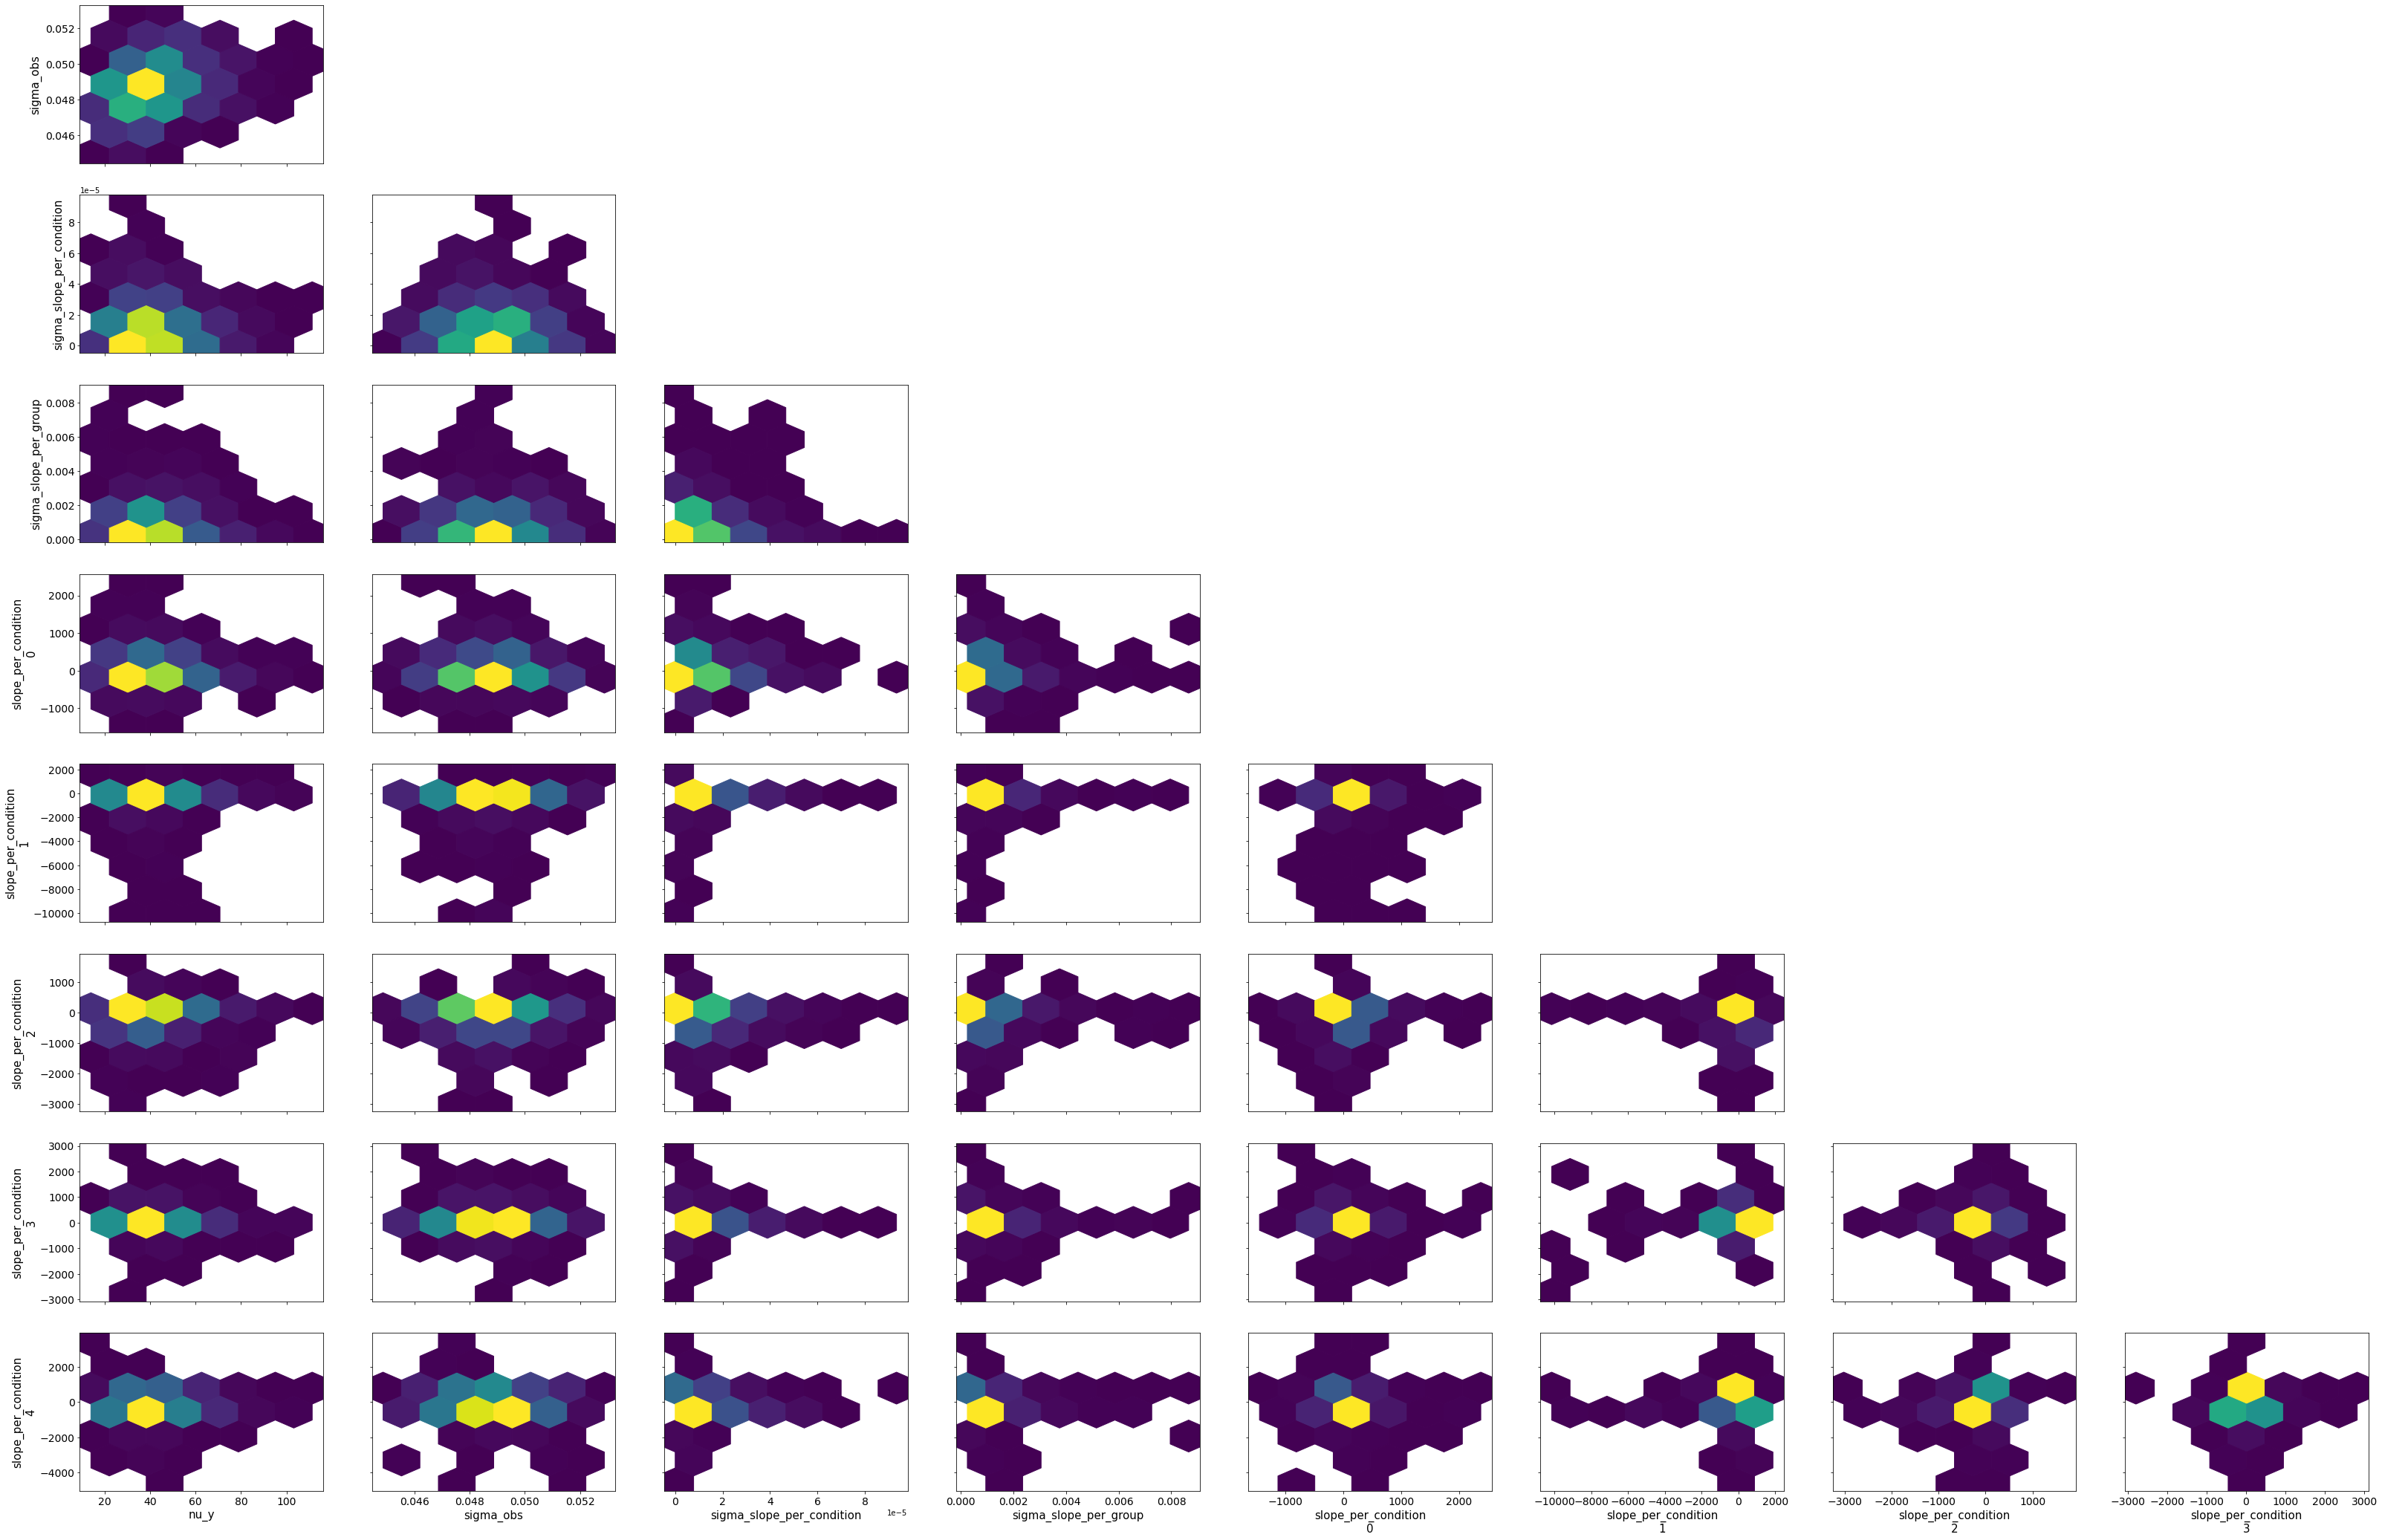
# Vanilla robust no interept or slope
bw = BayesRegression(df=df, y='isi', treatment='stim', condition=['neuron', 'mouse'], group='mouse')
bw.fit(model=(models.model_hierarchical),
       do_make_change='subtract',
       dist_y='student',
       robust_slopes=True,
       add_group_intercept=False,
       add_group_slope=False,
       fold_change_index_cols=('stim', 'mouse', 'neuron', 'neuron_x_mouse'))

bw.plot_model_quality()
# Vanilla robust, intercept only
bw = BayesRegression(df=df, y='isi', treatment='stim', condition=['neuron', 'mouse'], group='mouse')
bw.fit(model=(models.model_hierarchical),
       do_make_change='subtract',
       dist_y='student',
       robust_slopes=True,
       add_group_intercept=True,
       add_group_slope=False,
       fold_change_index_cols=('stim', 'mouse', 'neuron', 'neuron_x_mouse'))

bw.plot_model_quality()
# Vanilla robust, slopes only
bw = BayesRegression(df=df, y='isi', treatment='stim', condition=['neuron', 'mouse'], group='mouse')
bw.fit(model=(models.model_hierarchical),
       do_make_change='subtract',
       dist_y='student',
       robust_slopes=True,
       add_group_intercept=False,
       add_group_slope=True,
       fold_change_index_cols=('stim', 'mouse', 'neuron', 'neuron_x_mouse'))

bw.plot_model_quality()
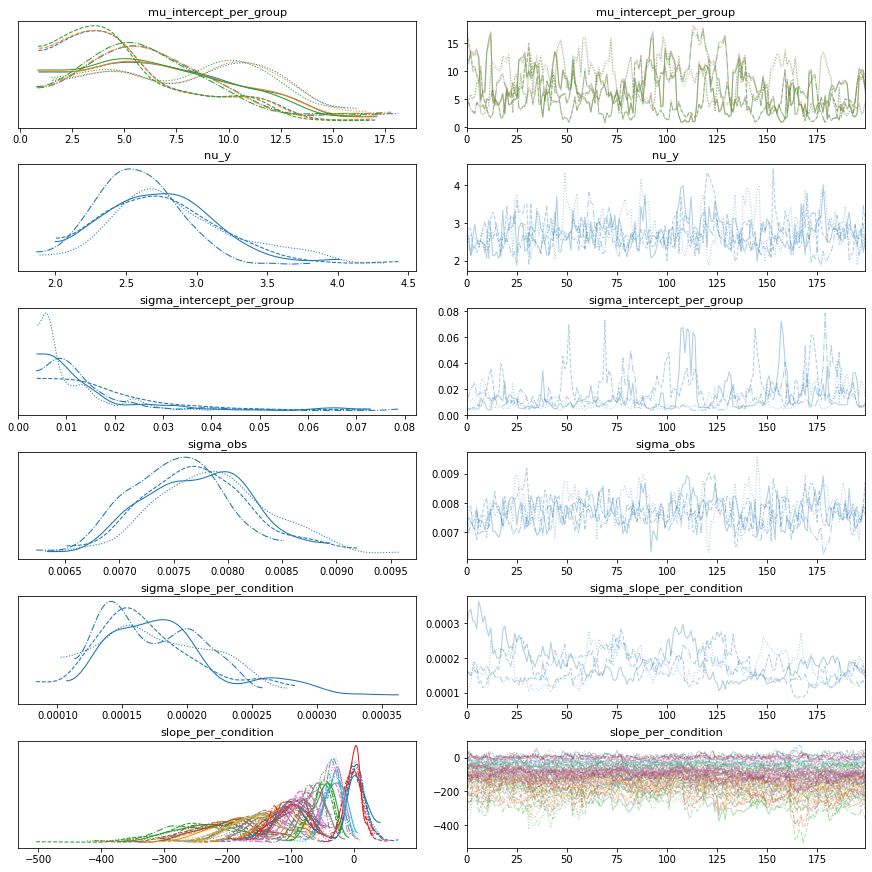
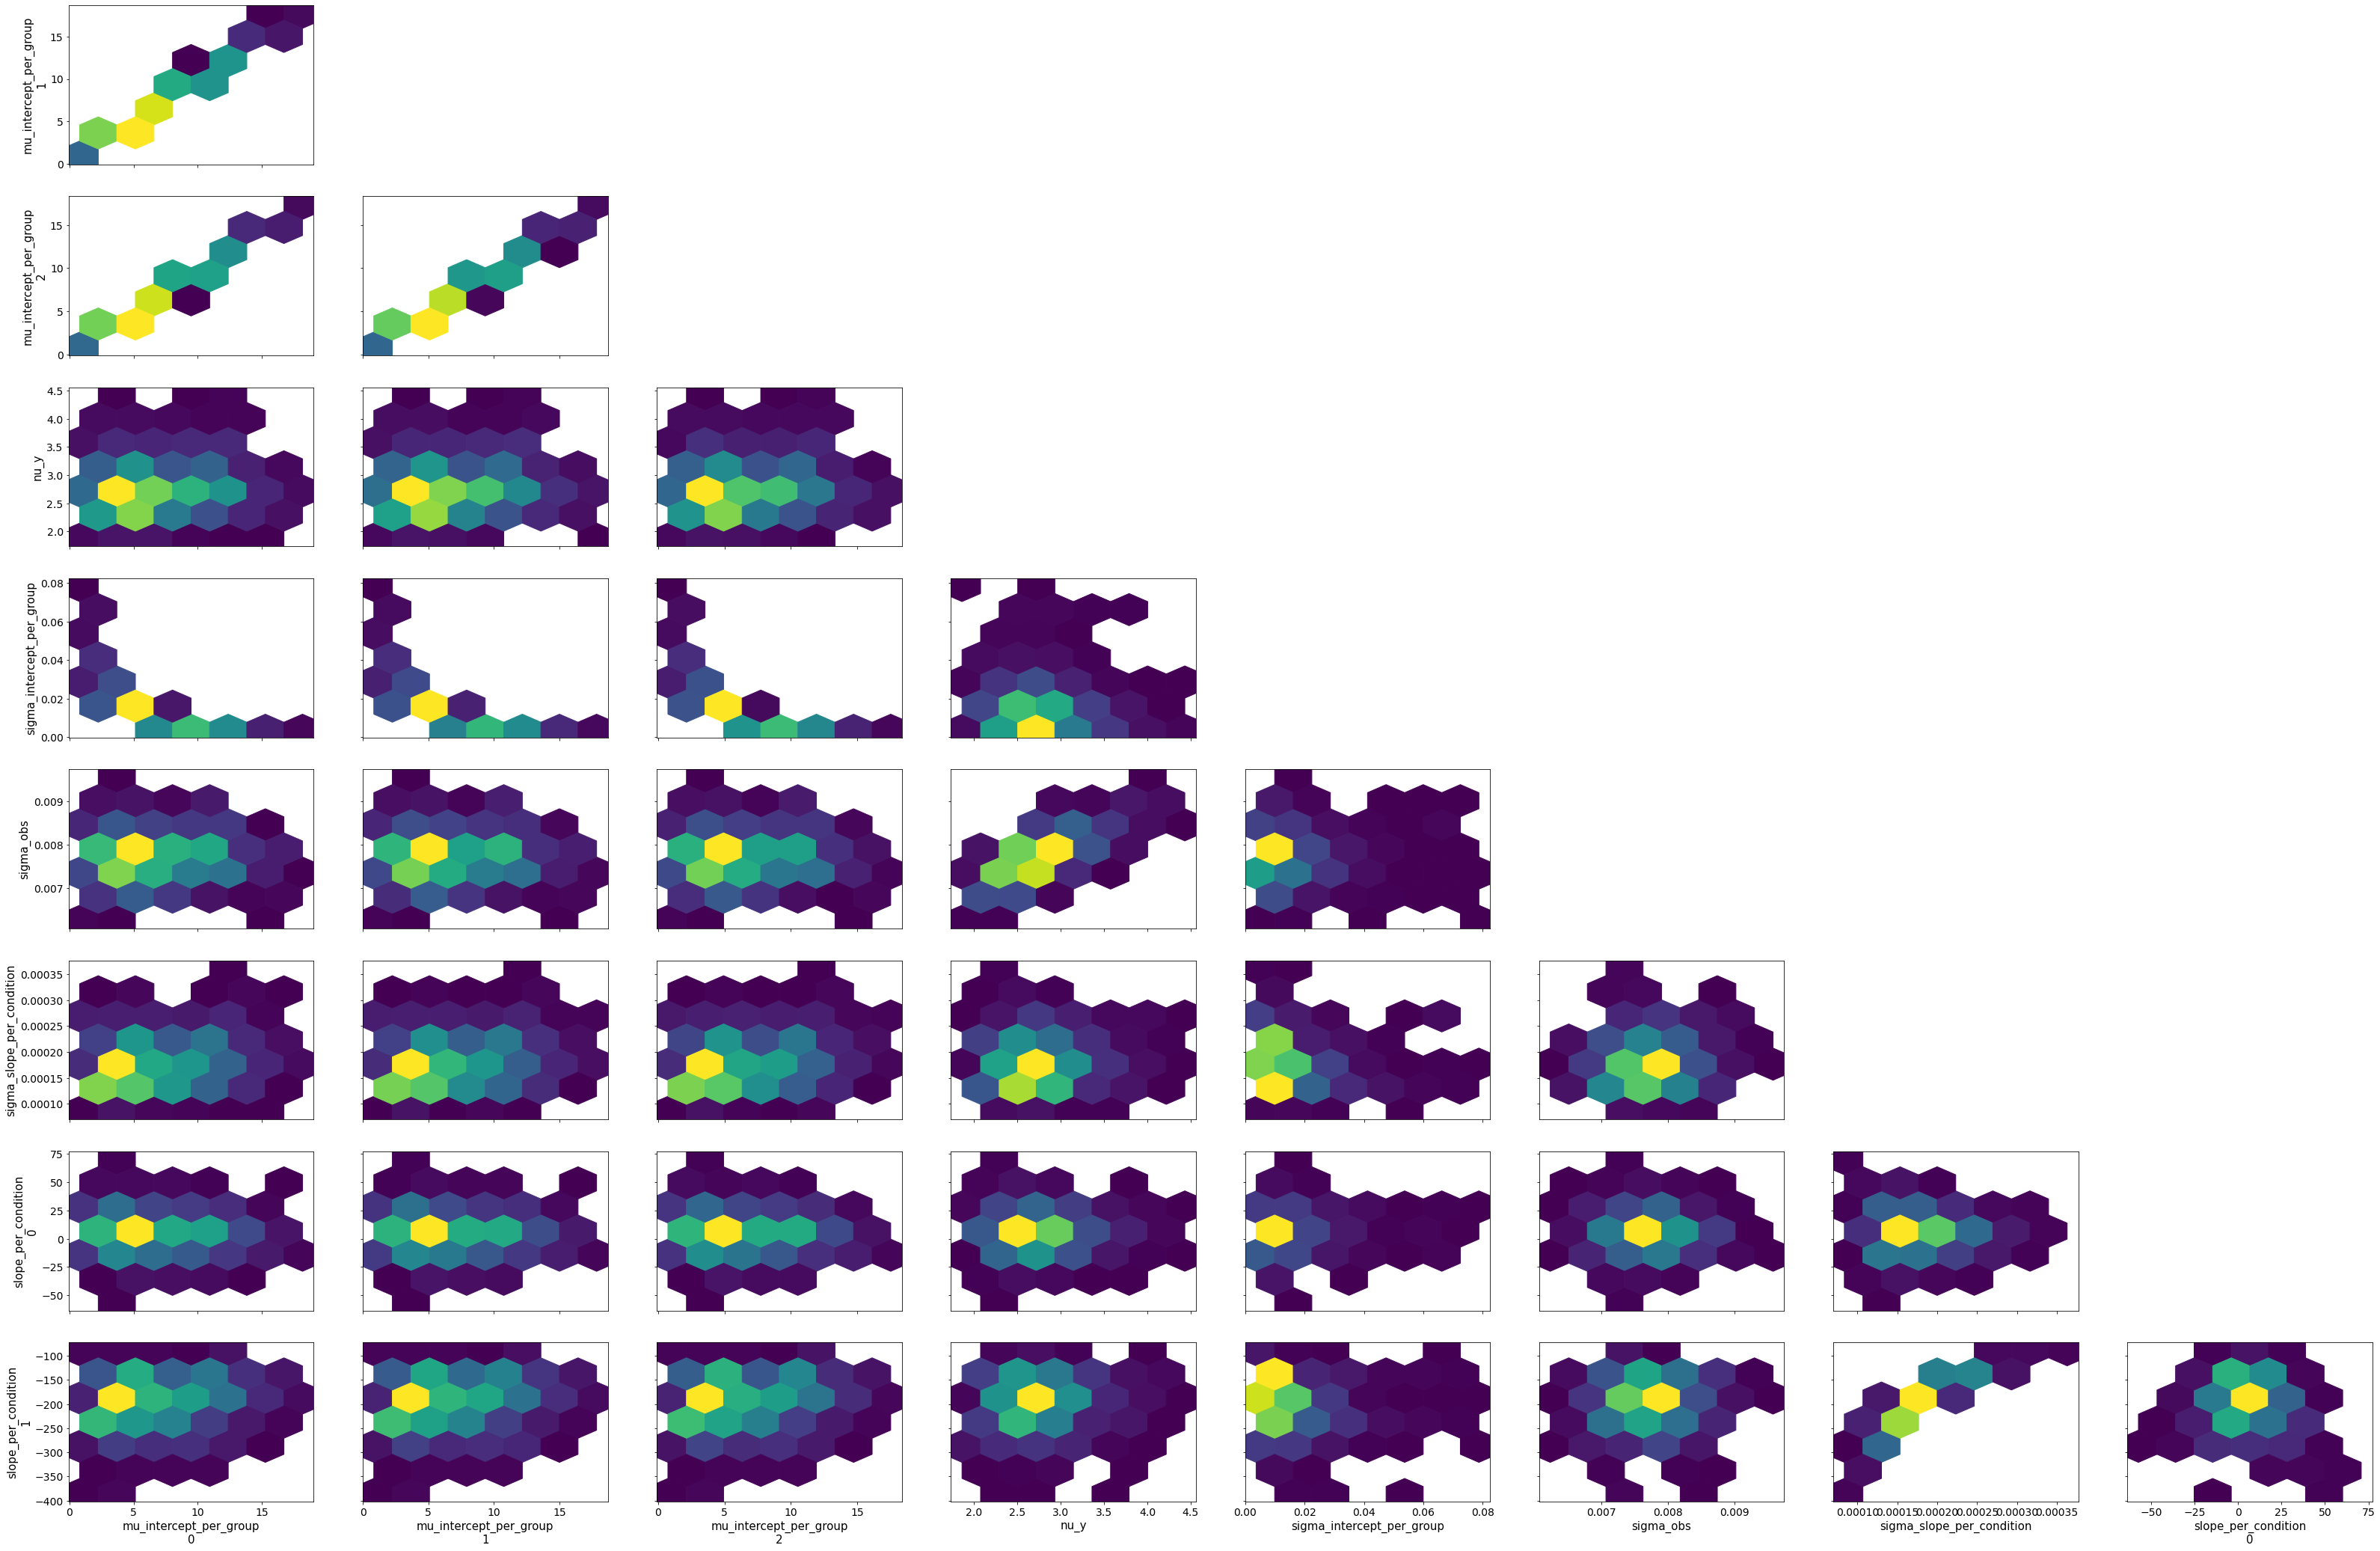
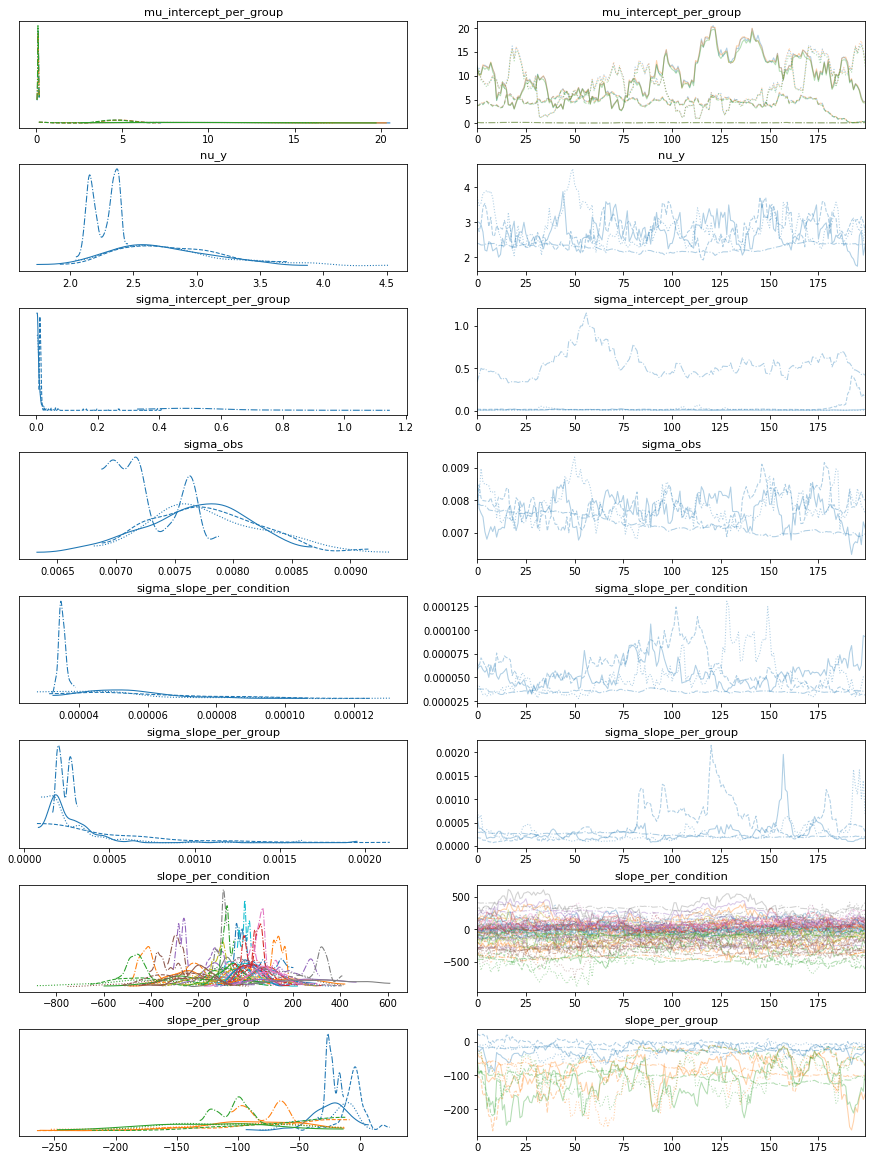
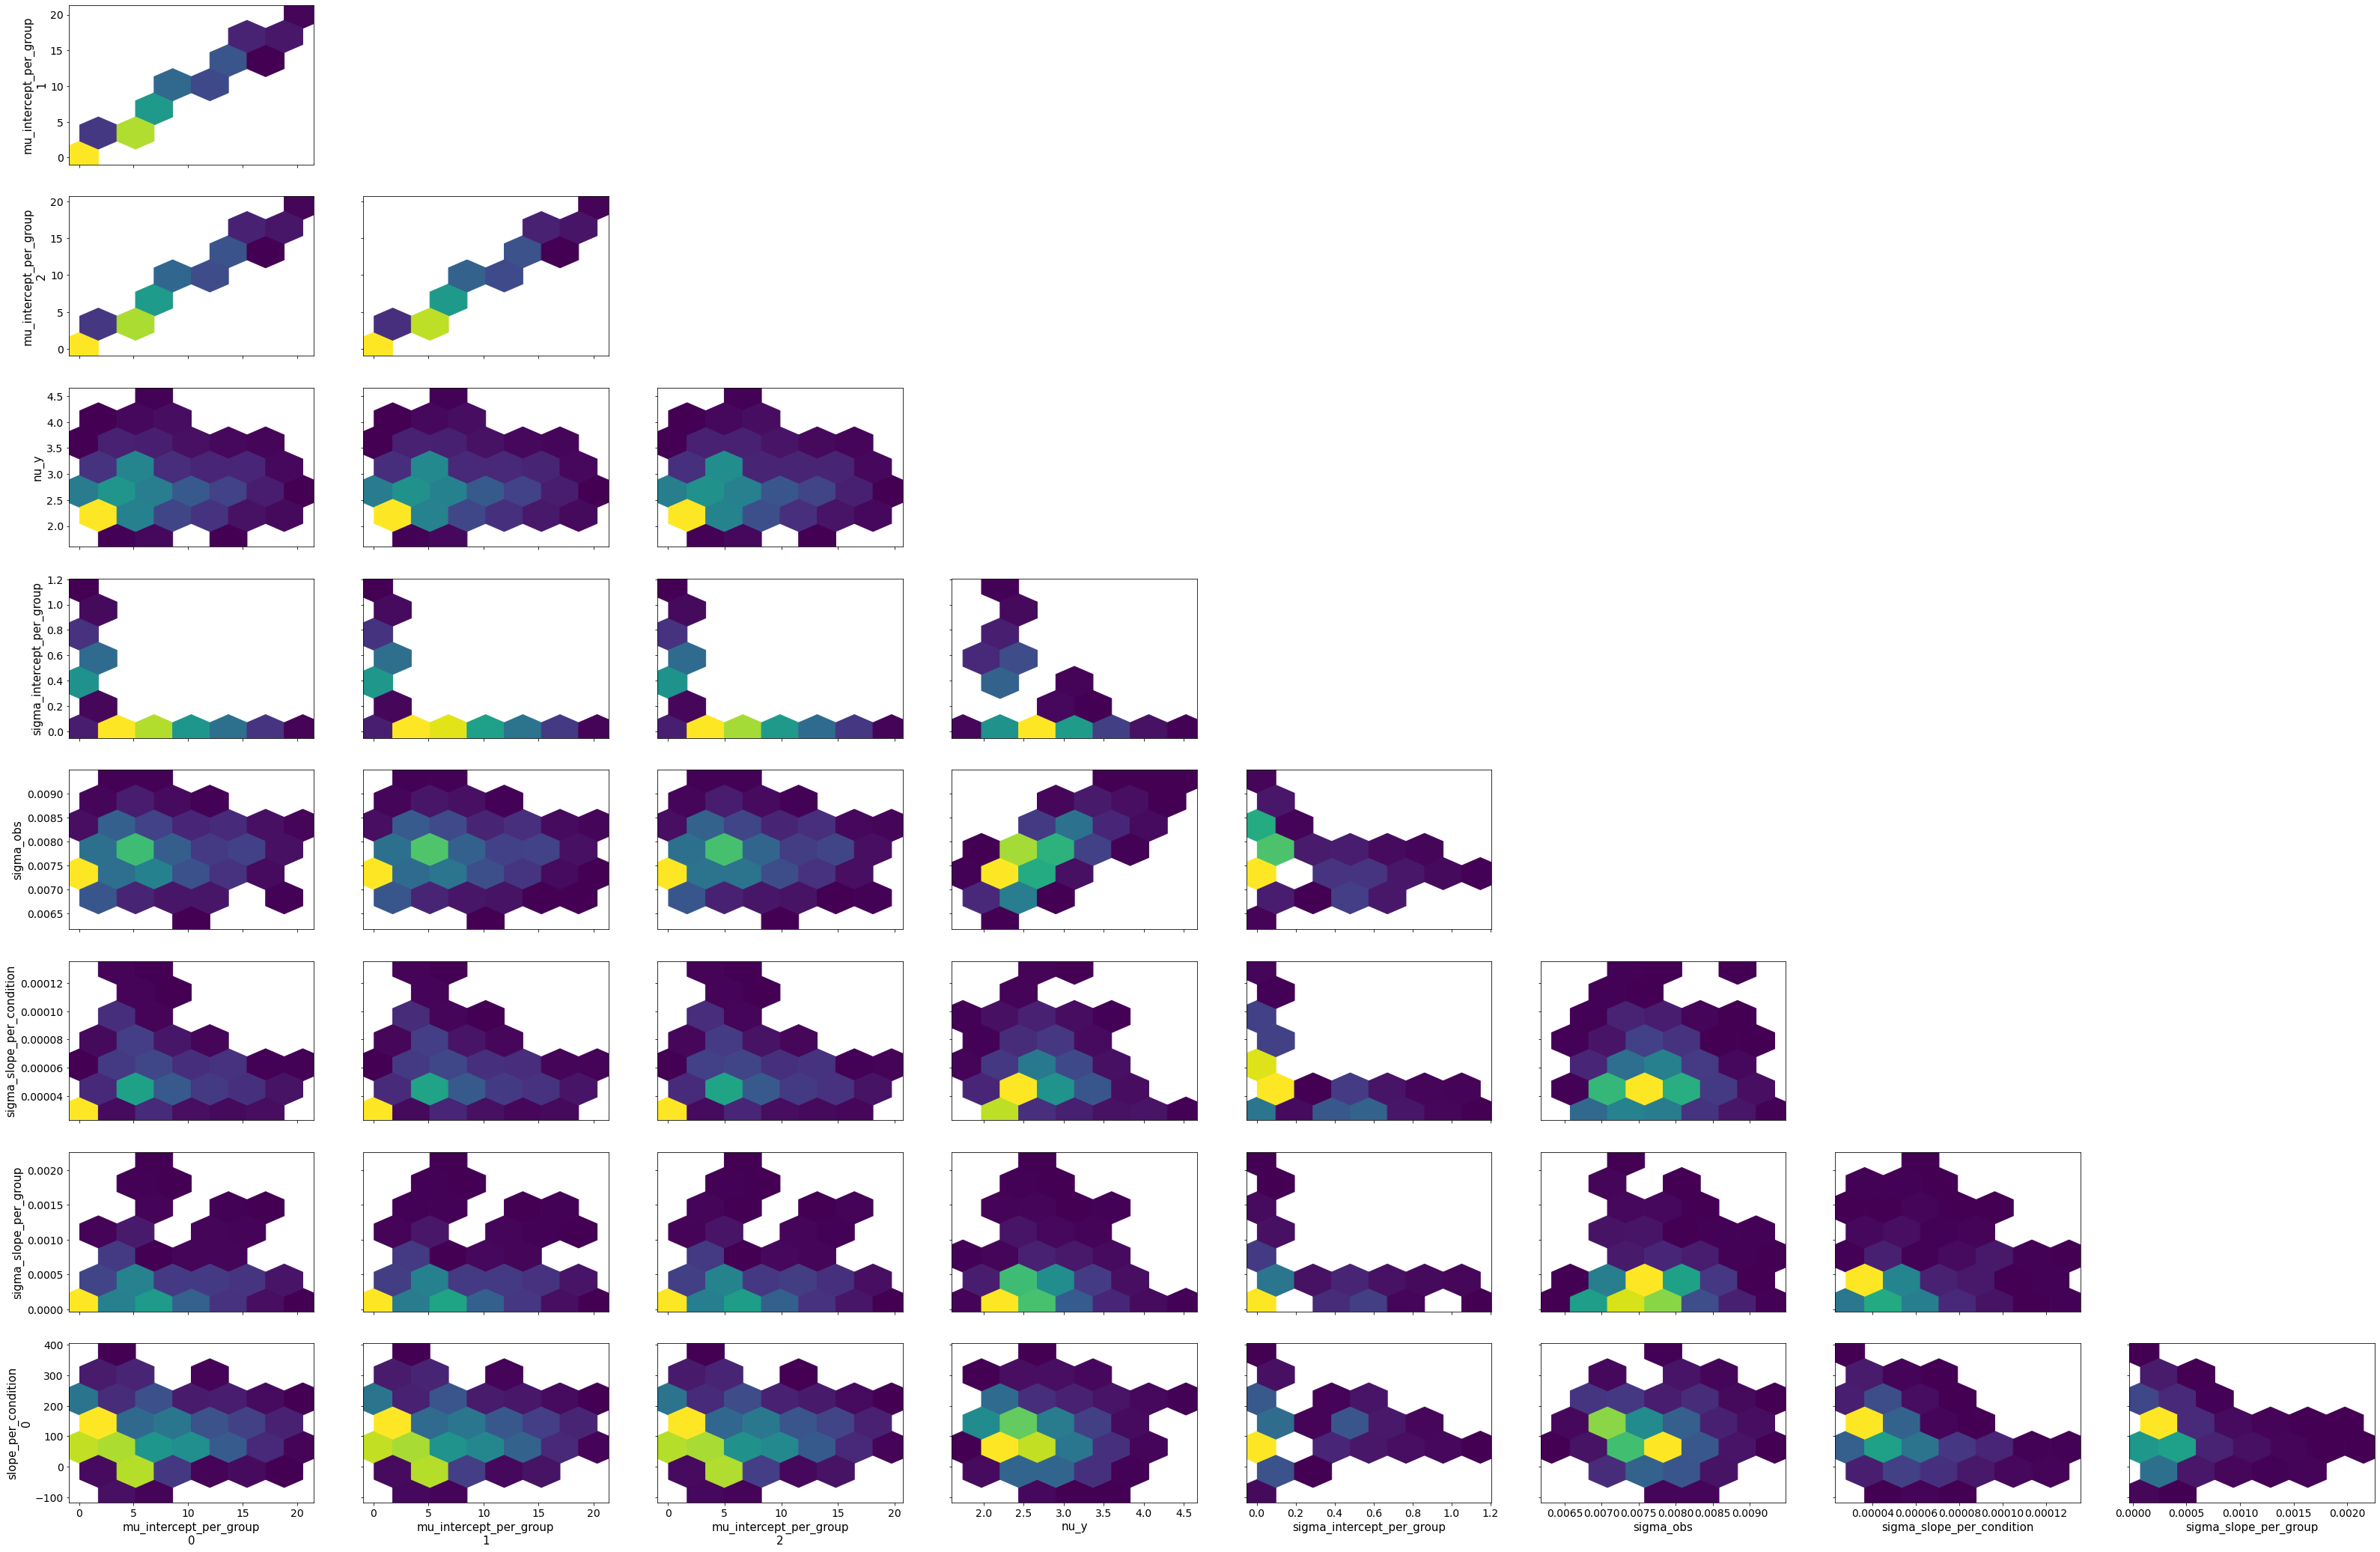
# Vanilla robust intercept and group
bw = BayesRegression(df=df, y='isi', treatment='stim', condition=['neuron', 'mouse'], group='mouse')
bw.fit(model=(models.model_hierarchical),
       do_make_change='subtract',
       dist_y='student',
       robust_slopes=True,
       add_group_intercept=True,
       add_group_slope=True,
       fold_change_index_cols=('stim', 'mouse', 'neuron', 'neuron_x_mouse'))

bw.plot_model_quality()
# Gamma GLM intercept only
bw = BayesRegression(df=df, y='isi', treatment='stim', condition=['neuron', 'mouse'], group='mouse')
bw.fit(model=(models.model_hierarchical),
       do_make_change='subtract',
       dist_y='gamma',
       robust_slopes=False,
       add_group_intercept=True,
       add_group_slope=False,
       fold_change_index_cols=('stim', 'mouse', 'neuron', 'neuron_x_mouse'))

bw.plot_model_quality()
group slopes+ group intercepts=>divergences
LME fails
bw = LMERegression(df=df, y='isi', treatment='stim', condition=['neuron_x_mouse'], group='mouse', )
bw.fit(add_data=False, add_group_intercept=True, add_group_slope=False)
Using formula isi ~ (1|mouse) + stim| neuron_x_mouse__0 + stim|neuron_x_mouse__1 + stim|neuron_x_mouse__2 + stim|neuron_x_mouse__3 + stim|neuron_x_mouse__4 + stim|neuron_x_mouse__5 + stim|neuron_x_mouse__6 + stim|neuron_x_mouse__7 + stim|neuron_x_mouse__8 + stim|neuron_x_mouse__9 + stim|neuron_x_mouse__10 + stim|neuron_x_mouse__11 + stim|neuron_x_mouse__12 + stim|neuron_x_mouse__13 + stim|neuron_x_mouse__14 + stim|neuron_x_mouse__15 + stim|neuron_x_mouse__16 + stim|neuron_x_mouse__17
                            Coef. Std.Err.        z  P>|z|  [0.025  0.975]
Intercept                   0.080    0.014    5.798  0.000   0.053   0.107
1 | mouse                  -0.007    0.007   -0.975  0.329  -0.021   0.007
stim | neuron_x_mouse__0    0.004    0.002    1.873  0.061  -0.000   0.009
stim | neuron_x_mouse__1   -0.001    0.002   -0.617  0.537  -0.006   0.003
stim | neuron_x_mouse__2   -0.014    0.002   -5.848  0.000  -0.018  -0.009
stim | neuron_x_mouse__3   -0.016    0.002   -6.668  0.000  -0.020  -0.011
stim | neuron_x_mouse__4   -0.026    0.002  -10.890  0.000  -0.030  -0.021
stim | neuron_x_mouse__5   -0.031    0.002  -13.320  0.000  -0.036  -0.027
stim | neuron_x_mouse__6    0.021    0.002    9.041  0.000   0.017   0.026
stim | neuron_x_mouse__7    0.010    0.002    4.396  0.000   0.006   0.015
stim | neuron_x_mouse__8    0.003    0.002    1.380  0.168  -0.001   0.008
stim | neuron_x_mouse__9    0.002    0.002    0.776  0.438  -0.003   0.006
stim | neuron_x_mouse__10  -0.009    0.002   -3.788  0.000  -0.014  -0.004
stim | neuron_x_mouse__11  -0.013    0.002   -5.632  0.000  -0.018  -0.009
stim | neuron_x_mouse__12   0.025    0.002   10.687  0.000   0.021   0.030
stim | neuron_x_mouse__13   0.023    0.002    9.843  0.000   0.019   0.028
stim | neuron_x_mouse__14   0.009    0.002    3.705  0.000   0.004   0.013
stim | neuron_x_mouse__15   0.006    0.002    2.447  0.014   0.001   0.010
stim | neuron_x_mouse__16  -0.005    0.002   -2.269  0.023  -0.010  -0.001
stim | neuron_x_mouse__17  -0.011    0.002   -4.507  0.000  -0.015  -0.006
Group Var                   0.000    0.019
/home/m/env_jb1/lib/python3.8/site-packages/statsmodels/regression/mixed_linear_model.py:2237: ConvergenceWarning: The MLE may be on the boundary of the parameter space.
  warnings.warn(msg, ConvergenceWarning)
<bayes_window.lme.LMERegression at 0x7f10dcb78640>
bw.chart.display()
#bw.facet(column='mouse').display()
"Proper faceting will work when data addition is implemented in fit_lme()"
'Proper faceting will work when data addition is implemented in fit_lme()'
bw = LMERegression(df=df, y='isi', treatment='stim', condition=['neuron_x_mouse'], group='mouse', )
bw.fit(add_data=False, add_group_intercept=True, add_group_slope=True)
Using formula isi ~ (stim|mouse)  + stim| neuron_x_mouse__0 + stim|neuron_x_mouse__1 + stim|neuron_x_mouse__2 + stim|neuron_x_mouse__3 + stim|neuron_x_mouse__4 + stim|neuron_x_mouse__5 + stim|neuron_x_mouse__6 + stim|neuron_x_mouse__7 + stim|neuron_x_mouse__8 + stim|neuron_x_mouse__9 + stim|neuron_x_mouse__10 + stim|neuron_x_mouse__11 + stim|neuron_x_mouse__12 + stim|neuron_x_mouse__13 + stim|neuron_x_mouse__14 + stim|neuron_x_mouse__15 + stim|neuron_x_mouse__16 + stim|neuron_x_mouse__17
                            Coef. Std.Err.        z  P>|z|  [0.025  0.975]
Intercept                   0.075    0.010    7.736  0.000   0.056   0.094
stim | mouse               -0.007    0.007   -0.975  0.329  -0.021   0.007
stim | neuron_x_mouse__0    0.002    0.003    0.734  0.463  -0.004   0.009
stim | neuron_x_mouse__1   -0.004    0.003   -1.104  0.270  -0.010   0.003
stim | neuron_x_mouse__2   -0.016    0.003   -4.966  0.000  -0.022  -0.010
stim | neuron_x_mouse__3   -0.018    0.003   -5.572  0.000  -0.024  -0.012
stim | neuron_x_mouse__4   -0.028    0.003   -8.688  0.000  -0.034  -0.022
stim | neuron_x_mouse__5   -0.033    0.003  -10.482  0.000  -0.040  -0.027
stim | neuron_x_mouse__6    0.026    0.006    4.704  0.000   0.015   0.037
stim | neuron_x_mouse__7    0.015    0.006    2.744  0.006   0.004   0.026
stim | neuron_x_mouse__8    0.008    0.006    1.472  0.141  -0.003   0.019
stim | neuron_x_mouse__9    0.007    0.006    1.217  0.224  -0.004   0.018
stim | neuron_x_mouse__10  -0.004    0.006   -0.708  0.479  -0.015   0.007
stim | neuron_x_mouse__11  -0.008    0.006   -1.486  0.137  -0.019   0.003
stim | neuron_x_mouse__12   0.023    0.003    7.381  0.000   0.017   0.029
stim | neuron_x_mouse__13   0.021    0.003    6.746  0.000   0.015   0.027
stim | neuron_x_mouse__14   0.007    0.003    2.127  0.033   0.001   0.013
stim | neuron_x_mouse__15   0.004    0.003    1.180  0.238  -0.002   0.010
stim | neuron_x_mouse__16  -0.007    0.003   -2.369  0.018  -0.014  -0.001
stim | neuron_x_mouse__17  -0.013    0.003   -4.053  0.000  -0.019  -0.007
Group Var                   0.000    0.019
/home/m/env_jb1/lib/python3.8/site-packages/statsmodels/regression/mixed_linear_model.py:2237: ConvergenceWarning: The MLE may be on the boundary of the parameter space.
  warnings.warn(msg, ConvergenceWarning)
<bayes_window.lme.LMERegression at 0x7f10dcb7ec10>
bw.chart
Need nested design, but get singular matrix:
bw = LMERegression(df=df, y='isi', treatment='stim', condition=['neuron_x_mouse'], group='mouse', )
try:
    bw.fit(add_data=False, add_group_intercept=True, add_group_slope=True, add_nested_group=True)
except Exception as e:
    print(e)
Using formula isi ~ (stim|mouse) + stim| neuron_x_mouse__0:mouse + stim|neuron_x_mouse__1:mouse + stim|neuron_x_mouse__2:mouse + stim|neuron_x_mouse__3:mouse + stim|neuron_x_mouse__4:mouse + stim|neuron_x_mouse__5:mouse + stim|neuron_x_mouse__6:mouse + stim|neuron_x_mouse__7:mouse + stim|neuron_x_mouse__8:mouse + stim|neuron_x_mouse__9:mouse + stim|neuron_x_mouse__10:mouse + stim|neuron_x_mouse__11:mouse + stim|neuron_x_mouse__12:mouse + stim|neuron_x_mouse__13:mouse + stim|neuron_x_mouse__14:mouse + stim|neuron_x_mouse__15:mouse + stim|neuron_x_mouse__16:mouse + stim|neuron_x_mouse__17:mouse
Singular matrix